
UTI ELSS Tax Saver Fund - Regular Plan - Growth Option
Fund Manager : Mr. Vishal Chopda FM 1,Not Applicable FM 2,Not Applicable FM 3,Not Applicable FM 4 | Benchmark : NIFTY 500 TRI | Category : Equity: ELSS
NAV as on 12-06-2025
AUM as on 30-05-2025
Rtn ( Since Inception )
12.06%
Inception Date
Aug 01, 2005
Expense Ratio
1.89%
Fund Status
Open Ended Scheme
Min. Investment (Rs)
500
Min. Topup (Rs)
500
Min. SIP Amount (Rs)
500
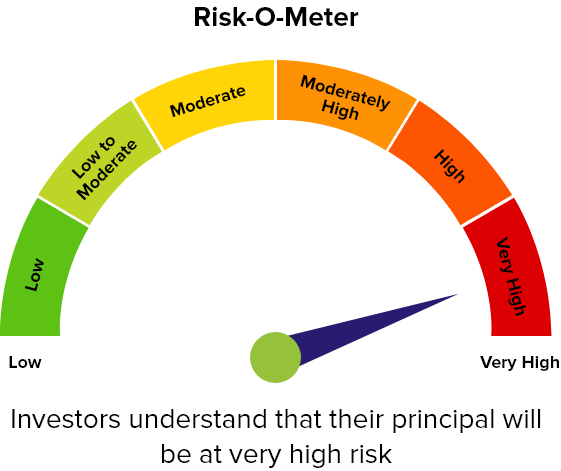
Risk Status
very high
Investment Objective : The primary objective of the scheme is to invest predominantly in equity and equity related securities of companies across the market capitalization spectrum. Securities shall also include fully/ partly convertible debentures/ bonds.
Returns (%)
| 1 Mon (%) | 3 Mon (%) | 6 Mon (%) | 1 Yr (%) | 3 Yrs (%) | 5 Yrs (%) | 10 Yrs (%) | |
|---|---|---|---|---|---|---|---|
| Fund | 1.92 | 12.32 | -1.95 | 4.22 | 17.07 | 21.02 | 12.67 |
| Benchmark - NIFTY 500 TRI | 7.88 | 15.42 | 0.52 | 8.0 | 20.34 | 24.25 | 14.57 |
| Category - Equity: ELSS | 2.88 | 13.25 | -2.87 | 5.01 | 20.21 | 23.53 | 14.1 |
| Rank within Category | 30 | 24 | 18 | 29 | 30 | 31 | 20 |
| Number of Funds within Category | 42 | 42 | 41 | 41 | 37 | 37 | 28 |
Returns less than 1 year are in absolute and Returns greater than 1 year period are compounded annualised (CAGR)
Equity Holdings (Top 10)
| Sector | Allocation (%) |
|---|
Sector Allocation (%)
Asset Allocation
| Asset Class | Allocation (%) |
|---|---|
| Equity | 96.79 |
| Cash & Cash Equivalents | 3.16 |
Portfolio Behavior
| Mean | 15.37 |
| Sharpe Ratio | 0.67 |
| Alpha | -2.15 |
| Beta | 0.94 |
| Standard Deviation | 14.13 |
| Sortino | 1.12 |
| Portfolio Turnover | 26 |
Market Cap Distribution
Yearly Performance (%)
Standard Performance
Riskometer
SIP Returns (Monthly SIP of Rs. 10,000)
| 3 Year | 5 Year | 10 Year | 15 Year | |||||||||
|---|---|---|---|---|---|---|---|---|---|---|---|---|
| Scheme Name | Invested Amt | Current Value | XIRR (%) | Invested Amt | Current Value | XIRR (%) | Invested Amt | Current Value | XIRR (%) | Invested Amt | Current Value | XIRR (%) |
| UTI ELSS Tax Saver Fund Reg Gr | 360,000 | 441,966 | 14.56 | 600,000 | 852,376 | 14.44 | 1,200,000 | 2,463,799 | 13.96 | 1,800,000 | 5,310,191 | 13.39 |
| NIFTY 500 TRI | 360,000 | 460,678 | 17.63 | 600,000 | 920,043 | 17.64 | 1,200,000 | 2,767,725 | 16.16 | 1,800,000 | 6,076,812 | 14.96 |
| Equity: ELSS | 360,000 | 461,126 | 17.64 | 600,000 | 918,917 | 17.49 | 1,200,000 | 2,741,392 | 15.85 | 1,800,000 | 6,317,943 | 15.3 |
Disclaimer : Mutualfundtools.com has gathered all the data, information, statistics from the sources believed to be highly reliable and true. All necessary precautions have been taken to avoid any error, lapse or insufficiency, however, no representations or warranties are made (express or implied) as to the reliability, accuracy or completeness of such information. mutualfundtools.com cannot be held liable for any loss arising directly or indirectly from the use of, or any action taken in on, any information appearing herein.
Returns less than 1 year are in absolute and greater than 1 year are compounded annualised (CAGR). SIP returns are shown in XIRR (%).
The Risk Level of any of the schemes must always be commensurate with the risk profile, investment objective or financial goals of the investor concerned. Mutual Fund Distributors (MFDs) or Registered Investment Advisors (RIAs) should take the risk profile and investment needs of individual investors into consideration and make scheme(s) or asset allocation recommendations accordingly.
Mutual Fund investments are subject to market risks, read all scheme related documents carefully. Past performance may or may not be sustained in the future. Investors should always invest according to their risk appetite and consult with their mutual fund distributors or financial advisor before investing.